 Crime Reporter
Built for suburb watch groups
Crime reporting your neighbourhood can actually trust
One shared map for your suburb. Residents report incidents in under a minute, decide who may see the details, and everyone gets statistics that show whether things are getting better or worse.
- Server-side location masking
- Per-incident visibility
- Admin-drawn suburb borders
- Verified members only

Actual app screens from the Testridge demo neighbourhood, using sample reports.
Any suburb
Self-serve setup, approved by the platform team
Under a minute
Time to log an incident with a pin and photos
3 levels
Location precision, enforced on the server
Never sold
Your neighbourhood's data stays with your members
Everything a watch group needs
Designed around the two things residents care about most: reporting quickly, and not exposing their own address while doing it.
Pin it on the map
Drop a pin where it happened, pick the crime type, add times, photos and a case number.
You control the detail
Choose exact address, street only, or an approximate area. Location masking happens on the server, not in the browser.
Choose your audience
Share with all members, with the watch committee only, or publish to your suburb's public awareness page.
Statistics that hold up
Trends by crime type, day and hour, hotspot clusters and a severity-weighted safety score.
Corroborate and follow up
Neighbours confirm reports, moderators verify or resolve them, and discussion stays on the incident.
Run your own suburb
Request a neighbourhood, draw its borders on the map, approve members and set who may see what.
Privacy by default
Reporting a crime shouldn't publish your home address
Masking happens in the database, before the data ever reaches a browser. Public pins are never more precise than street level, no matter what the reporter chose.
Exact address
The true pin and full address are shown to you, to your watch committee, and to members when your neighbourhood allows it.
Street level
Everyone outside your neighbourhood — including public visitors — sees a rounded position and the street name at most.
Approximate area
Choose this and even members see only a general area, with no street name attached to the report.
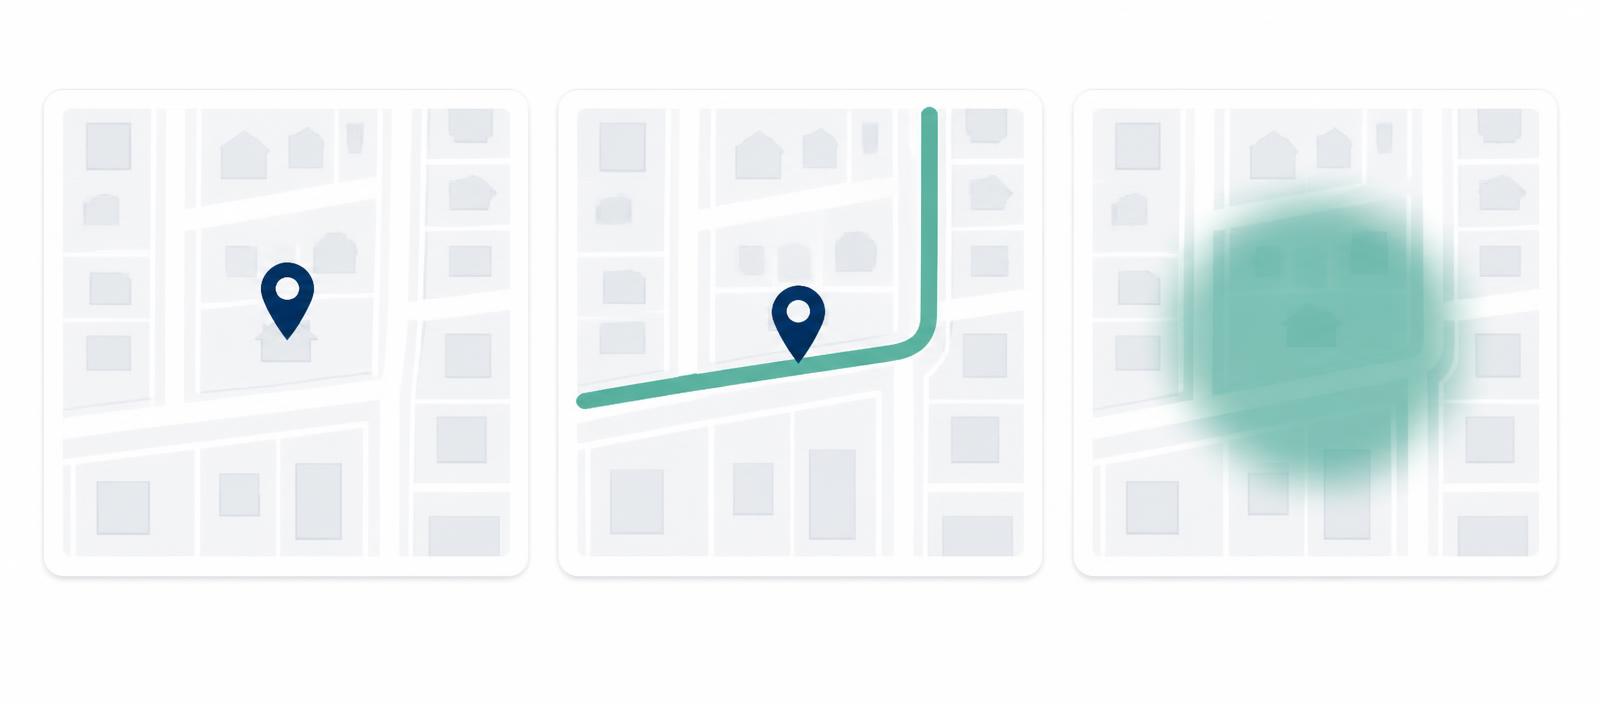
Exact · Street level · Approximate area
Live in three steps
01
Request your neighbourhood
Create an account, name your suburb and submit it for approval.
02
Draw the borders
Trace your area on the map and invite residents to join as members.
03
Start reporting
Incidents appear on the shared map instantly, with statistics building from day one.
Statistics
Numbers your committee can present
Reports over time bucketed by day, week or month depending on the range you pick. Breakdowns by crime type, day of week and hour of day, hotspot clusters on the map, and a severity-weighted safety score you can track month to month. Moderators can export the register to CSV or print an area report.
See a public suburb page
Beyond reporting
Run the watch, not just the map
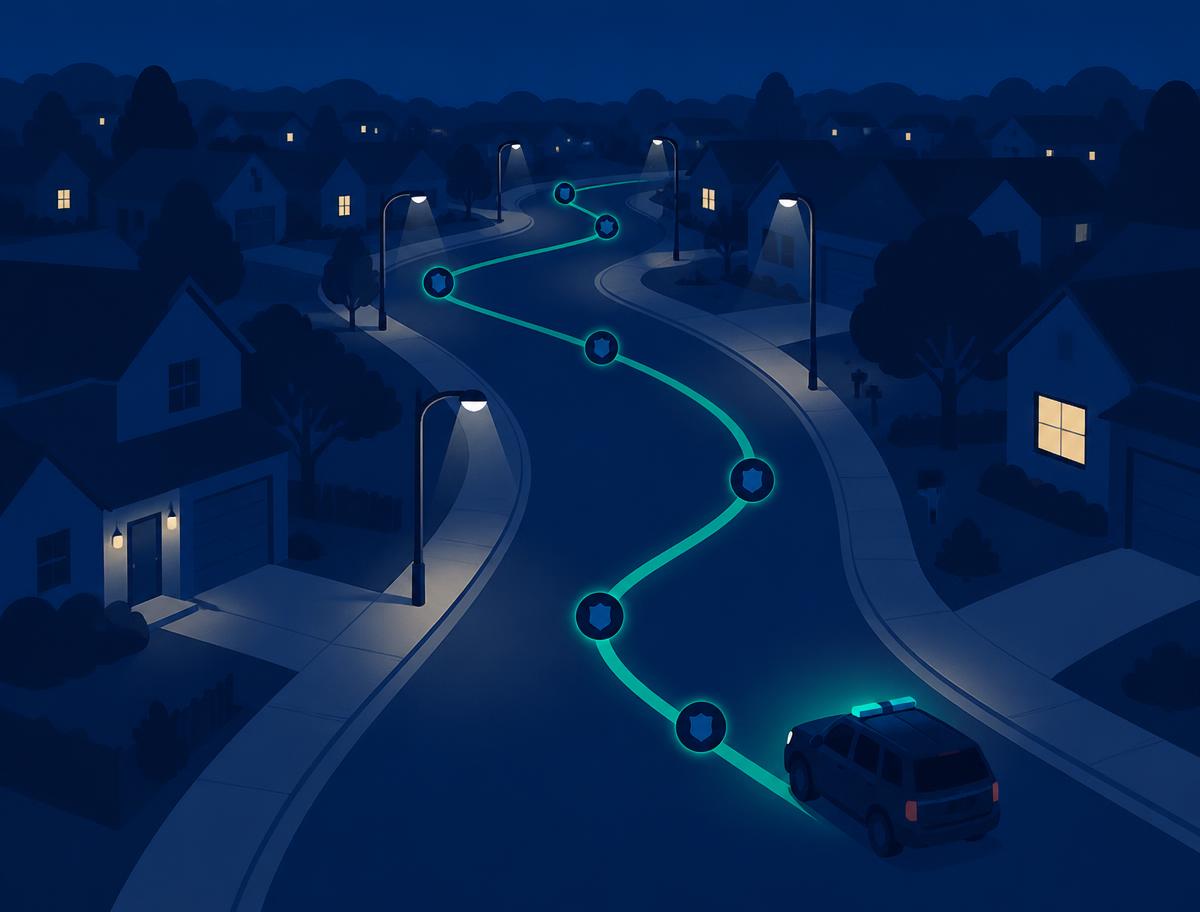
Reports are only half the job. The same account handles the people side of a suburb watch.
Patrol roster
Schedule shifts, assign volunteers, track check-in and check-out, and keep an audit log of who was out.
Coverage board
Volunteers request cover, others claim open shifts, and reminders go out automatically before a shift starts.
Safety broadcasts
Push an urgent alert to every member, with emergency contacts kept a tap away.
See it in action
Real screens from the app, captured in the Testridge demo neighbourhood with sample reports.


Questions residents ask
Bring Crime Reporter to your street
Free to start. Your neighbourhood's data stays visible only to the people you approve.
Create an admin account